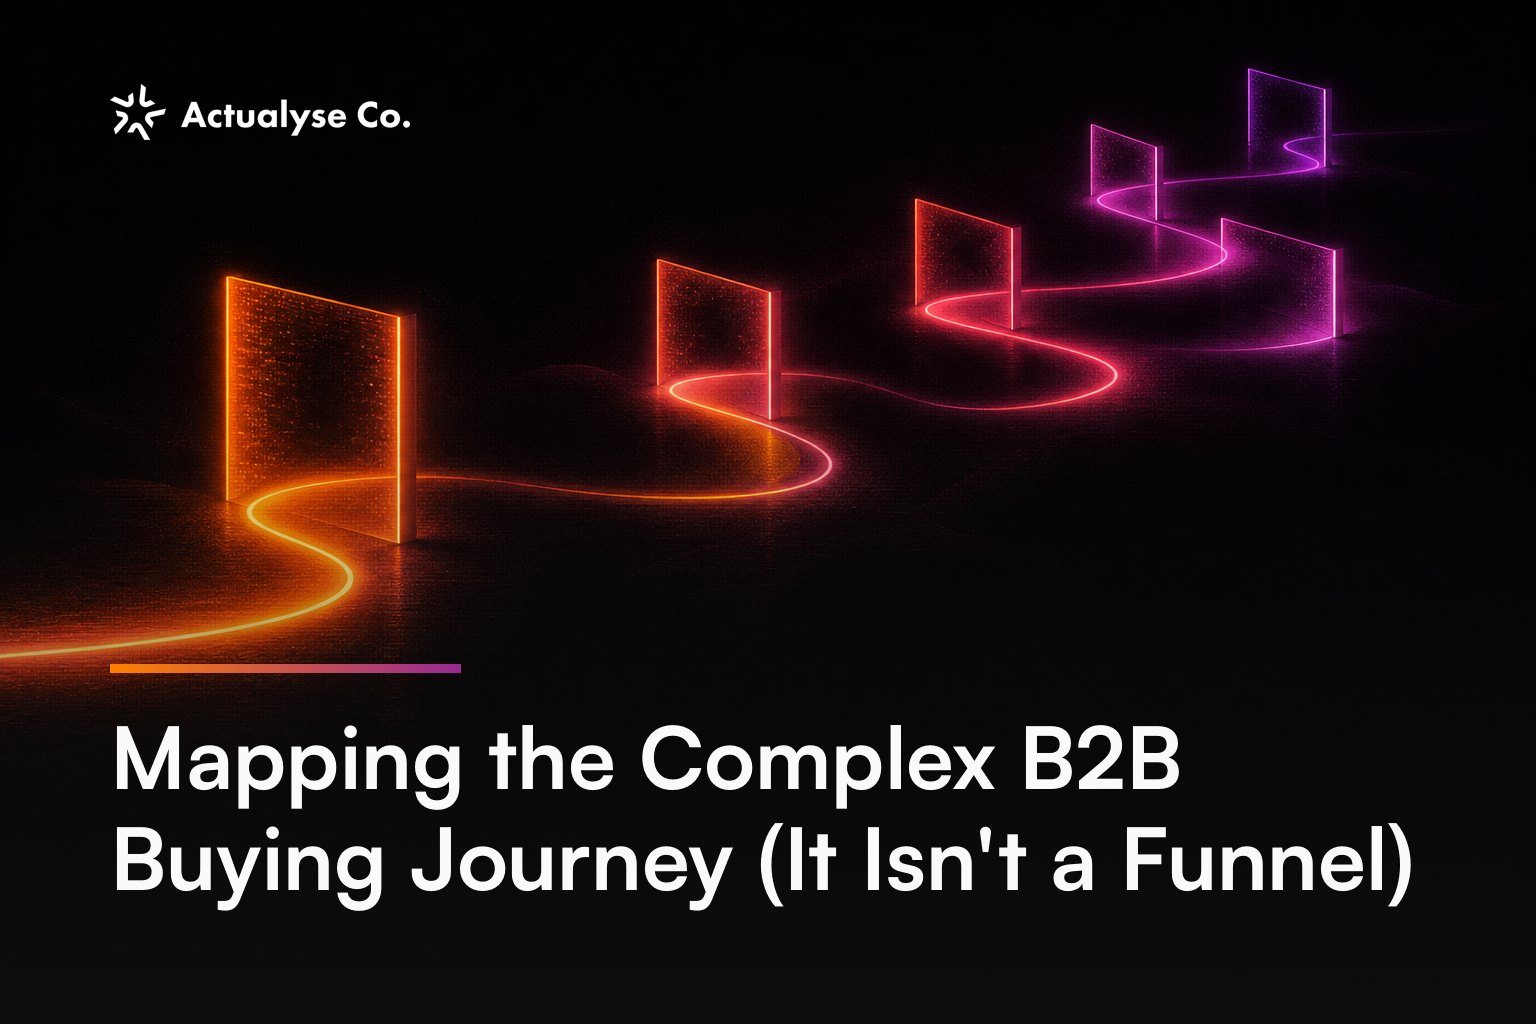
Why the complex B2B buying journey refuses a funnel
Your B2B funnel is not leaking; it is reporting only the investigations that happened to touch your systems. The hidden work still changes shortlists, budgets and timing, but none of it produces a neat event in GA4 or the CRM. A growth marketing strategy for complex B2B sales treats the buying journey as a set of parallel private investigations, because dismissing the invisible portion as noise makes the visible portion harder to read.
A standard five-stage funnel moves from anonymous visitor to lead, qualified opportunity, proposal and win. Buyers do not respect that sequence. They revisit practical fit after discussing price, reopen risk after seeing proof and pause the entire project while an internal constraint changes.
The version we see in audits usually starts at the form submission because that is where identity becomes available. The commercial clock started earlier. Our explanation of why sales cycles lengthen before a form appears covers that timing problem in detail.
The funnel remains useful for managing sales administration. It is a poor model of buyer behaviour.
The claim is falsifiable: if five recent opportunities can be reconstructed as the same ordered sequence, without repeated or overlapping questions, the funnel model wins.
Private investigations are the journey; funnel stages are merely company administration.
The visible and invisible portions of the journey
GA4 and a CRM show evidence generated inside systems the supplier controls. They do not show the complete decision.
There are two evidence layers.
The visible portion
Six common event types are visible: Google Ads clicks, GA4 page views, Search Console query-and-click aggregates, form submissions, booked meetings and CRM stage changes.
These events provide useful facts. Someone loaded a page. A form was completed. An opportunity was created on a particular date.
They cannot establish that the event was the beginning, which unanswered question caused the return or how many people handled the information elsewhere.
The invisible portion
Five common stakeholder actions happen off-site. An internal sponsor forwards screenshots through Teams. A technical evaluator compares requirements in a private document. Finance changes assumptions in a local spreadsheet. Procurement circulates contract concerns by email. A director asks a trusted peer whether the supplier is credible.
None is recorded in the supplier’s analytics because no first-party event fires. Private documents, conversations and third-party environments sit outside Google Tag Manager, GA4 and the CRM. Consent choices and device changes can also prevent separate visible events from joining into one recognisable journey.
Our documented website and brand projects show how architecture can accommodate these investigations. Lanteria’s broad Microsoft 365 HR capability was routed into clearer paths. AfriCap Hub separated catalogue discovery, filtering and registration. Savgen required structured navigation across technical products and industries. Lake Erie Shores kept stay and ownership journeys distinct under one site. Those were architecture decisions, not performance claims.
The honest limit here is that no mapping exercise recovers touches that were never observable. The map is for finding unanswered questions and weak routes, not reconstructing a perfect historical truth.
Visible evidence is a sample, never the journey.
The seven-row complex B2B buying journey map
Set aside 60 minutes and use five recent opportunity records: two won, two lost and one stalled. Pull evidence from sales notes, emails, site-search terms and recorded calls. Write down the buyer’s actual wording rather than translating it into funnel language.
Create the following seven-row map. The phases are diagnostic labels, not mandatory steps; several can run simultaneously or repeat.
| Phase | Question being asked | Person asking | Artefact that should answer it |
|---|---|---|---|
| 1. Trigger | What changed enough to justify action now? | Problem owner | Problem explainer or diagnostic |
| 2. Boundaries | What is included, excluded and dependent on us? | Project lead | Capability map with explicit exclusions |
| 3. Practical fit | Will this work with our existing process and technology? | Technical evaluator | Requirements or integration page |
| 4. Evidence | Has the supplier handled comparable constraints? | Internal sponsor | Relevant project story |
| 5. Commercial shape | What will this cost and consume internally? | Finance lead | Price range, assumptions and resource worksheet |
| 6. Risk | What could block approval or delivery? | Procurement or IT | Security, legal and delivery evidence pack |
| 7. Next move | What happens between approval and mobilisation? | Project owner | Decision checklist and implementation plan |
The person column identifies where a question originates; it is not a messaging prescription. The separate analysis of how decisions move inside B2B organisations handles authority and internal influence.
The artefact column turns research into a website decision. Some answers require substantial buyer-enablement content that supports internal progress. Others require better task-led B2B website navigation so existing evidence can actually be found.
Use four afternoon thresholds:
- More than two of the seven rows lack an artefact → commission those answers before increasing Google Ads spend.
- An answer requires more than two navigation choices from its landing page → create a direct route.
- The same question appears in three of five records → create one reusable artefact for it.
- An artefact has more than one accountable owner → assign one owner and one review date.
A useful map connects each live question to an owned answer.
A worked complex B2B buying journey over four months
Take an explicitly illustrative UK industrial software supplier. The buyer first recognises a problem on day 0 and signs on day 124. The example stipulates 17 known touches so the visibility gap can be inspected; a real analytics system would not reveal the entire sequence.
| Touch | Day | Action | Recorded in the supplier’s stack? |
|---|---|---|---|
| 1 | 0 | Operations director notes recurring production delays | No |
| 2 | 5 | Director asks an industry peer for suggestions | No |
| 3 | 12 | Project lead reads a vendor-neutral article | No |
| 4 | 20 | Anonymous direct visit to the supplier’s site | Yes — GA4 |
| 5 | 28 | Capability-page screenshot is shared in Teams | No |
| 6 | 34 | Technical evaluator searches without clicking | No |
| 7 | 39 | Project lead clicks a Google Ads result | Yes — Google Ads and GA4 |
| 8 | 47 | Suppliers are compared in an internal sheet | No |
| 9 | 55 | Integration page receives an anonymous direct visit | Yes — GA4 |
| 10 | 63 | Competitor PDF is discussed internally | No |
| 11 | 72 | Finance changes the private budget model | No |
| 12 | 85 | Sponsor returns through branded search | Yes — GA4 |
| 13 | 91 | Relevant project story is opened | Yes — GA4 |
| 14 | 96 | Demo form is submitted | Yes — GA4 and CRM |
| 15 | 103 | Demo is held | Yes — CRM and calendar |
| 16 | 112 | Procurement compares terms by email | No |
| 17 | 124 | Contract is signed | Yes — CRM |
Reported visibility is 8 touches versus 17 stipulated actions. Reported CRM duration is 28 days from demo request to signature versus 124 days of actual elapsed journey. GA4 could show three browser identities versus one underlying buying effort.
The five-stage funnel shows one record advancing. The map shows four question threads—fit, evidence, cost and risk—opening, pausing and returning.
Now add an illustrative content decision. The labelled inputs are: loaded technical-sales cost = £90 per hour; repeated integration explanation = 50 minutes; occurrence = six opportunities per quarter; production cost for a reusable artefact = £2,700.
Quarterly repetition cost = 6 × (50 ÷ 60 hours) × £90 = £450
Time-saving payback = £2,700 ÷ £450 per quarter = 6 quarters
Six quarters is too slow to justify the artefact on staff savings alone. Commission it only if the map also shows that the unanswered integration question is blocking progress across several opportunities.
Elapsed time exposes commercial work that session counts conceal.
If your website and campaign evidence cannot explain where committee-led deals slow down, map the buying journey with Actualyse — book a call
What does not work
The usual response is to make the visible funnel more elaborate. Four common fixes fail.
- Adding more CRM stages renames the supplier’s internal handling process. It does not expose peer calls, forwarded screenshots or private budget work.
- Redesigning only the homepage improves one surface while leaving technical, commercial and risk questions unanswered deeper in the site.
- Increasing retargeting frequency repeats exposure after a recorded visit. Repetition cannot resolve a missing integration answer or an unclear commercial boundary.
- Gating every PDF creates additional form records at the cost of distribution. Buyers still forward downloaded files privately, so the later investigation remains invisible.
The pattern we hit most often is a measurement problem being handed to design or media as though more activity will reveal the missing journey. It will not. The appropriate response is to improve the evidence buyers can use and the paths through which they can find it.
Cosmetic funnel fixes cannot repair missing decision evidence.
How to use a signal that will not sit still
Pull the same journey view on day 1, day 7 and day 14. A journey measured three times over a fortnight returns three different pictures.
In an illustrative comparison, snapshot A shows 8 tracked visits versus 5 in snapshot B and 11 in snapshot C. Recognised identities move from 2 versus 1 and then 3, despite all three views referring to the same commercial effort.
Five mechanics create that instability: consent choices, device switching, CRM-entry delays, rolling date boundaries and untagged shared links. Averaging the pictures produces a tidier number, not a truer journey.
Use three stability rules:
- A core count moving by more than 25% between snapshots while CRM opportunity volume moves by less than 10% → freeze budget reallocations and inspect a 90-day window.
- The same unanswered question appearing in two of three snapshots or three of five interviews → act on the question regardless of path order.
- More than 20% of opportunities missing a first-observed date or mapped-question field → repair capture before interpreting journey speed.
In our growth marketing work built around decision signals, unstable path data is treated as a range. Recurring questions, missing evidence and broken routes are the more actionable signals.
Stable decisions come from recurring questions, not unstable paths.
FAQ
How many buyer interviews are enough to begin?
Start with six 30-minute interviews: two recent wins, two losses and two no-decisions. Add four more if fewer than three questions recur across the first six.
Where should the journey map live?
Use a spreadsheet until the map exceeds 25 artefacts or three people edit it weekly. Beyond either threshold, move it into a content operations board with named owners.
How often should the map be updated?
Refresh it quarterly. Bring the review forward if pricing changes by more than 15%, the main offer changes, or the median sales cycle moves by at least 30 days.
What should happen when buyer and sales evidence conflict?
When two sources contradict each other, retain both versions and mark their confidence. Commission one follow-up buyer interview instead of averaging the accounts into a false consensus.
Useful journey analysis ends with a named action and deadline.
Summary
Use these five operating rules:
- More than two empty rows in the seven-row map trigger content production before additional media spend.
- A question repeated in three of five opportunities earns one reusable artefact.
- More than two navigation choices trigger a direct route to the answer.
- A metric swing above 25% with opportunity movement below 10% triggers a 90-day review.
- Six buyer interviews per quarter remain the minimum refresh rule.
Actualyse builds websites and campaigns designed for long, committee-driven B2B sales cycles. Book a call to talk through where yours stands.